Kubernetes Observability Part 1: Prometheus + Grafana on Raspberry Pi with Persistent Storage

You can deploy all day, but if you can't see what your cluster is doing, you're flying blind. I added the observability layer to my Raspberry Pi homelab: Prometheus for metrics collection, Grafana for dashboards, and a dedicated SSD-backed storage layer to make sure I don't lose the data when a pod restarts.
Why persistent storage matters first
Prometheus stores time-series data on disk. Grafana stores its dashboards and configuration in a database backed by a PersistentVolume. If you deploy either one without thinking about storage, the default emptyDir volume means a pod restart wipes everything — your metrics history, your imported dashboards, your datasource configuration. Gone.
My cluster has a 1TB SSD attached to k8s-worker-1. I created a dedicated StorageClass called ssd-local-path that tells the local-path-provisioner to use /mnt/ssd on that specific node instead of the default SD card path. The key settings: reclaimPolicy: Retain so the data survives PVC deletions, and volumeBindingMode: WaitForFirstConsumer so the volume only gets created once a pod actually schedules.
The trick is that WaitForFirstConsumer alone doesn't pin the pod to the right node — it just delays binding. To guarantee every observability workload lands on the SSD, I labelled k8s-worker-1 with storage=ssd and added nodeSelector: { storage: ssd } to every observability Helm chart. Miss either half and the data ends up on an SD card somewhere.
Deploying kube-prometheus-stack
The kube-prometheus-stack Helm chart bundles Prometheus, Grafana, Alertmanager, node-exporter, kube-state-metrics, and the Prometheus Operator into a single install. On a Pi cluster, the default resource settings will OOMKill everything, so tuning was critical.
The values I landed on: Prometheus gets 512Mi request / 1Gi limit with 15Gi of storage and 15-day retention. Grafana gets 256Mi / 512Mi with 5Gi of storage. Alertmanager is lightweight at 32Mi / 64Mi with 1Gi. Every stateful component uses the ssd-local-path StorageClass and the storage: ssd nodeSelector.
Two settings in the Prometheus spec that I almost missed: serviceMonitorSelectorNilUsesHelmValues: false and podMonitorSelectorNilUsesHelmValues: false. Without these, Prometheus only discovers ServiceMonitors that carry the chart's specific release label. With them set to false, it discovers all ServiceMonitors regardless of labels — which is what you actually want when you start adding your own application metrics later.


Eight pods total: Prometheus, Grafana (3/3 — main container plus two sidecars for dashboard and datasource discovery), Alertmanager, the Prometheus Operator, kube-state-metrics, and three node-exporter pods (one per node as a DaemonSet).
Grafana: Gateway API, dashboards, and an OOMKill
I exposed Grafana the same way as every other service in this cluster — an HTTPRoute through the Envoy Gateway, pointing at the kube-prom-grafana Service on port 80. The certificate already covered grafana.webdemoapp.com as a SAN, so HTTPS worked immediately.
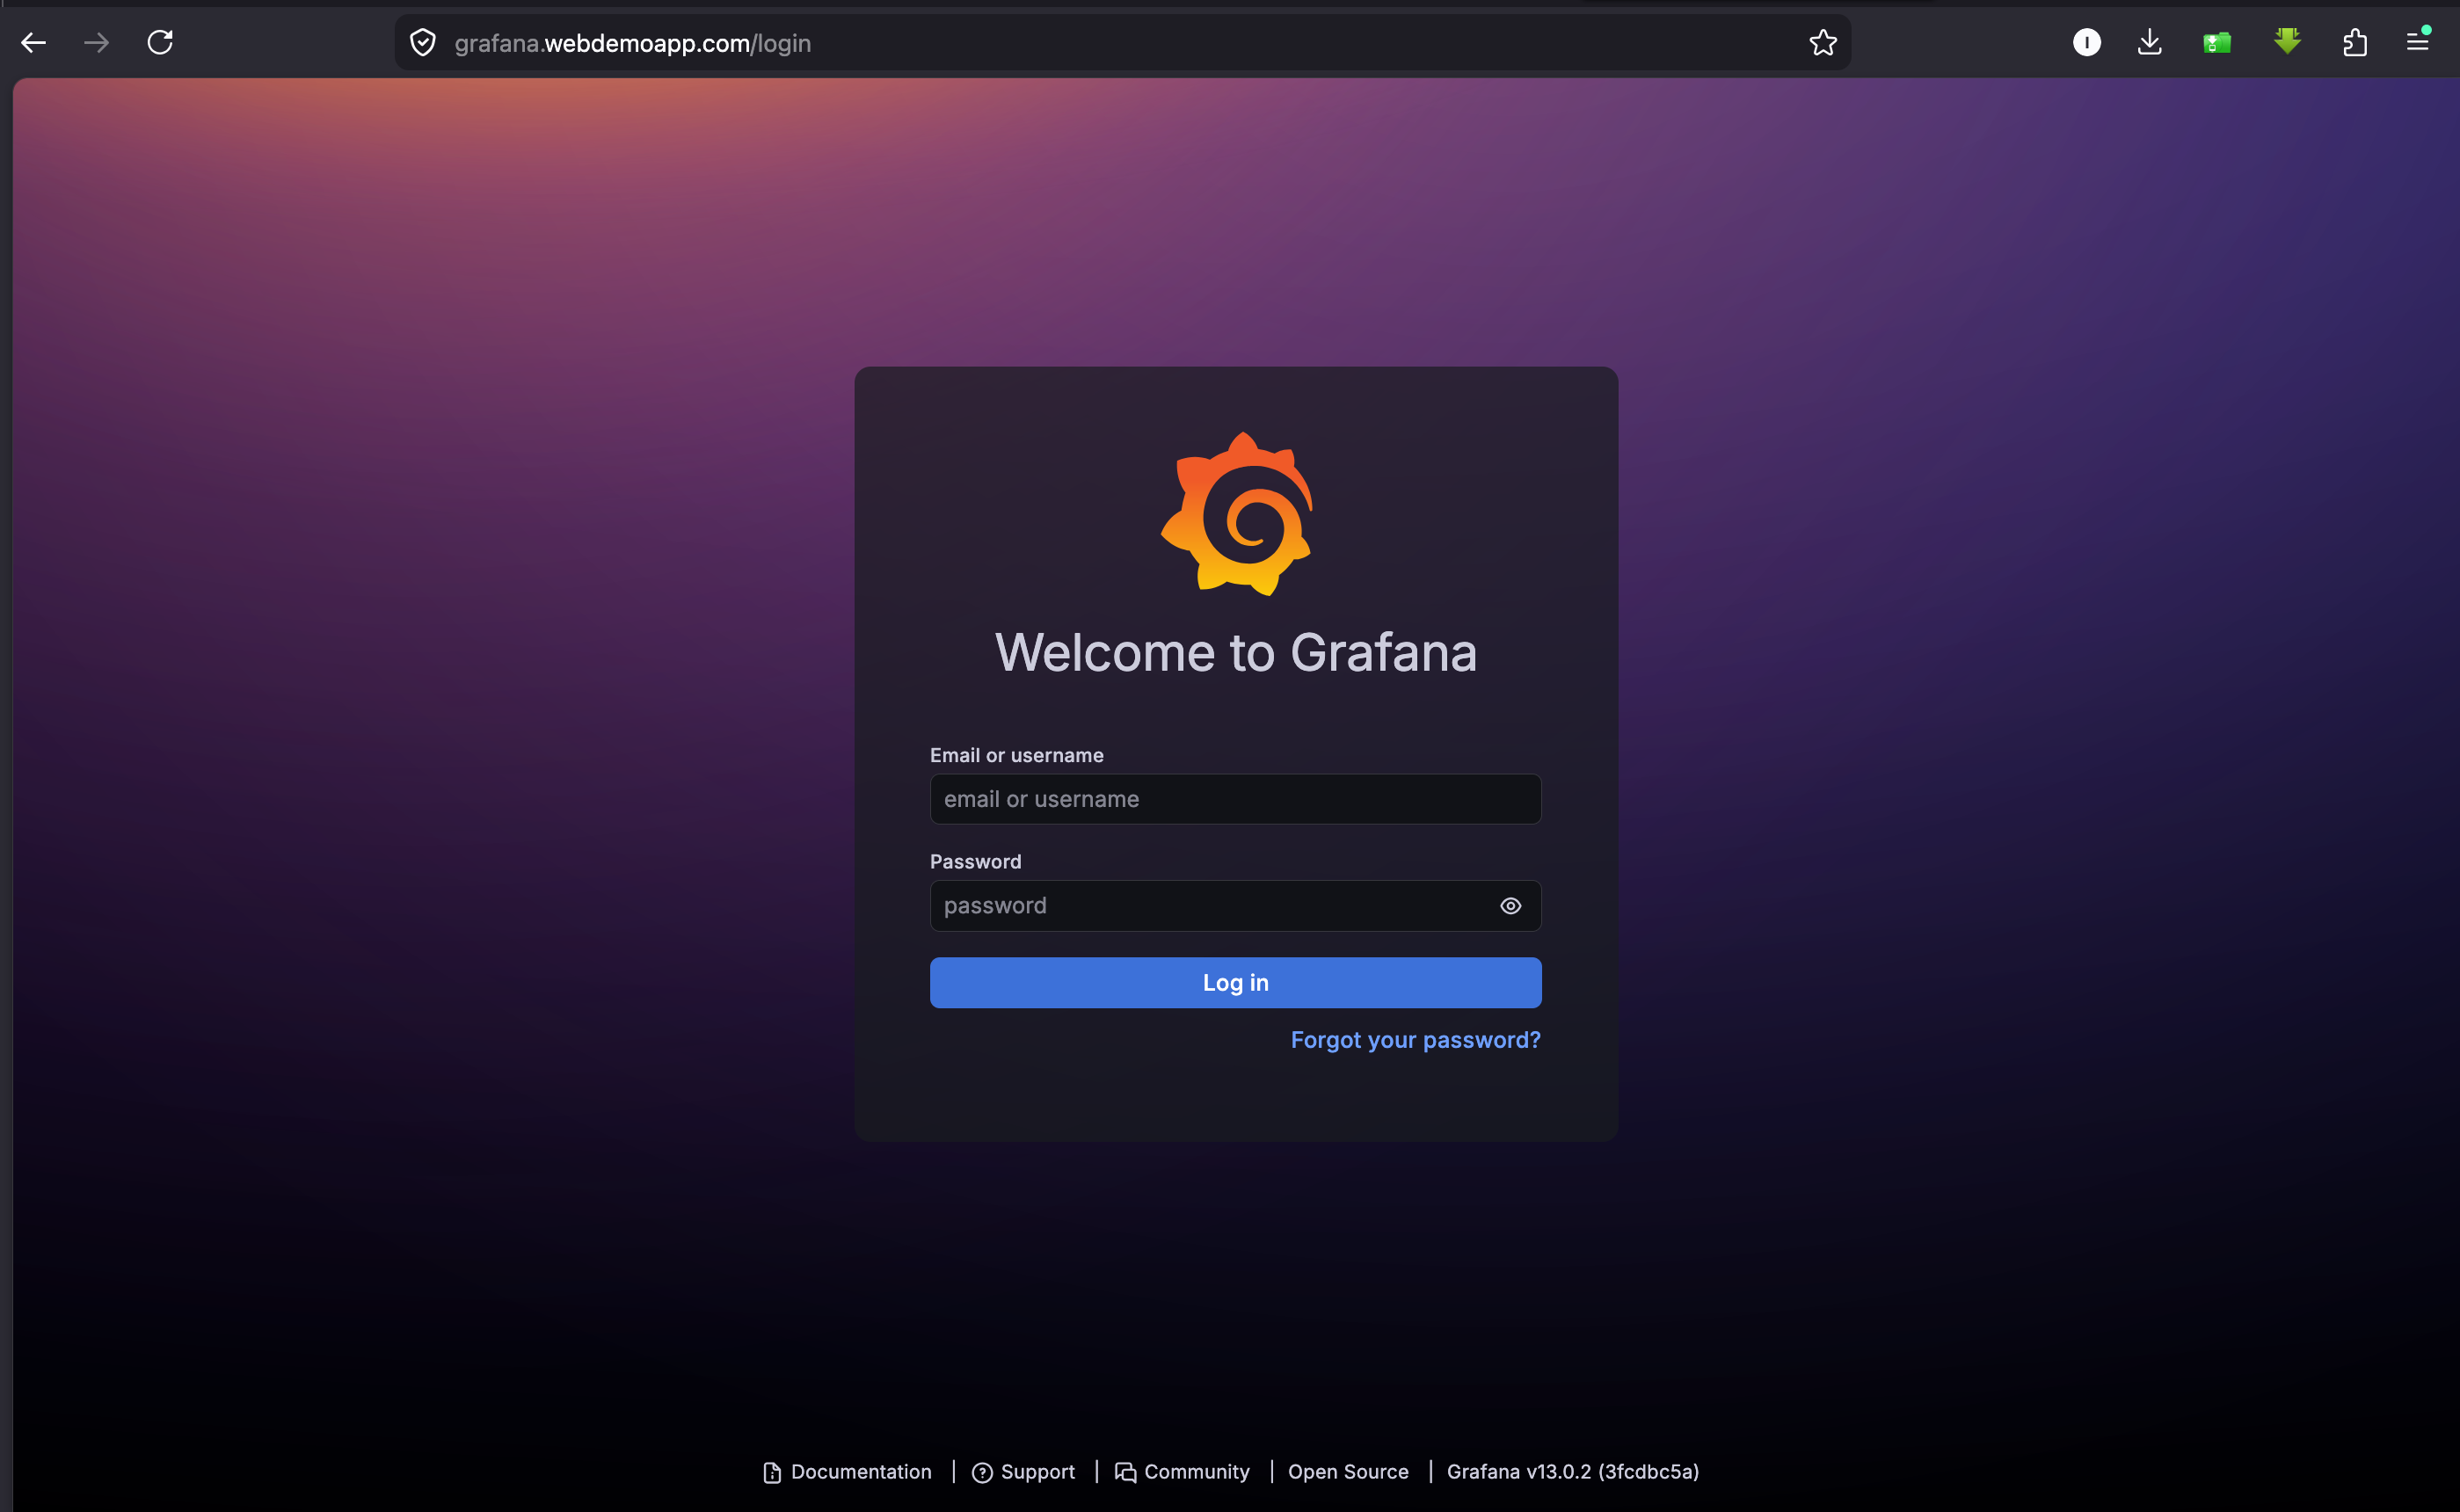
Importing dashboards was straightforward. Dashboard 1860 ("Node Exporter Full") gives you per-node CPU, memory, disk, and network metrics. The node dropdown shows all three Pis — k8s-master, k8s-worker-1, k8s-worker-2 — and every panel populates with real data immediately.
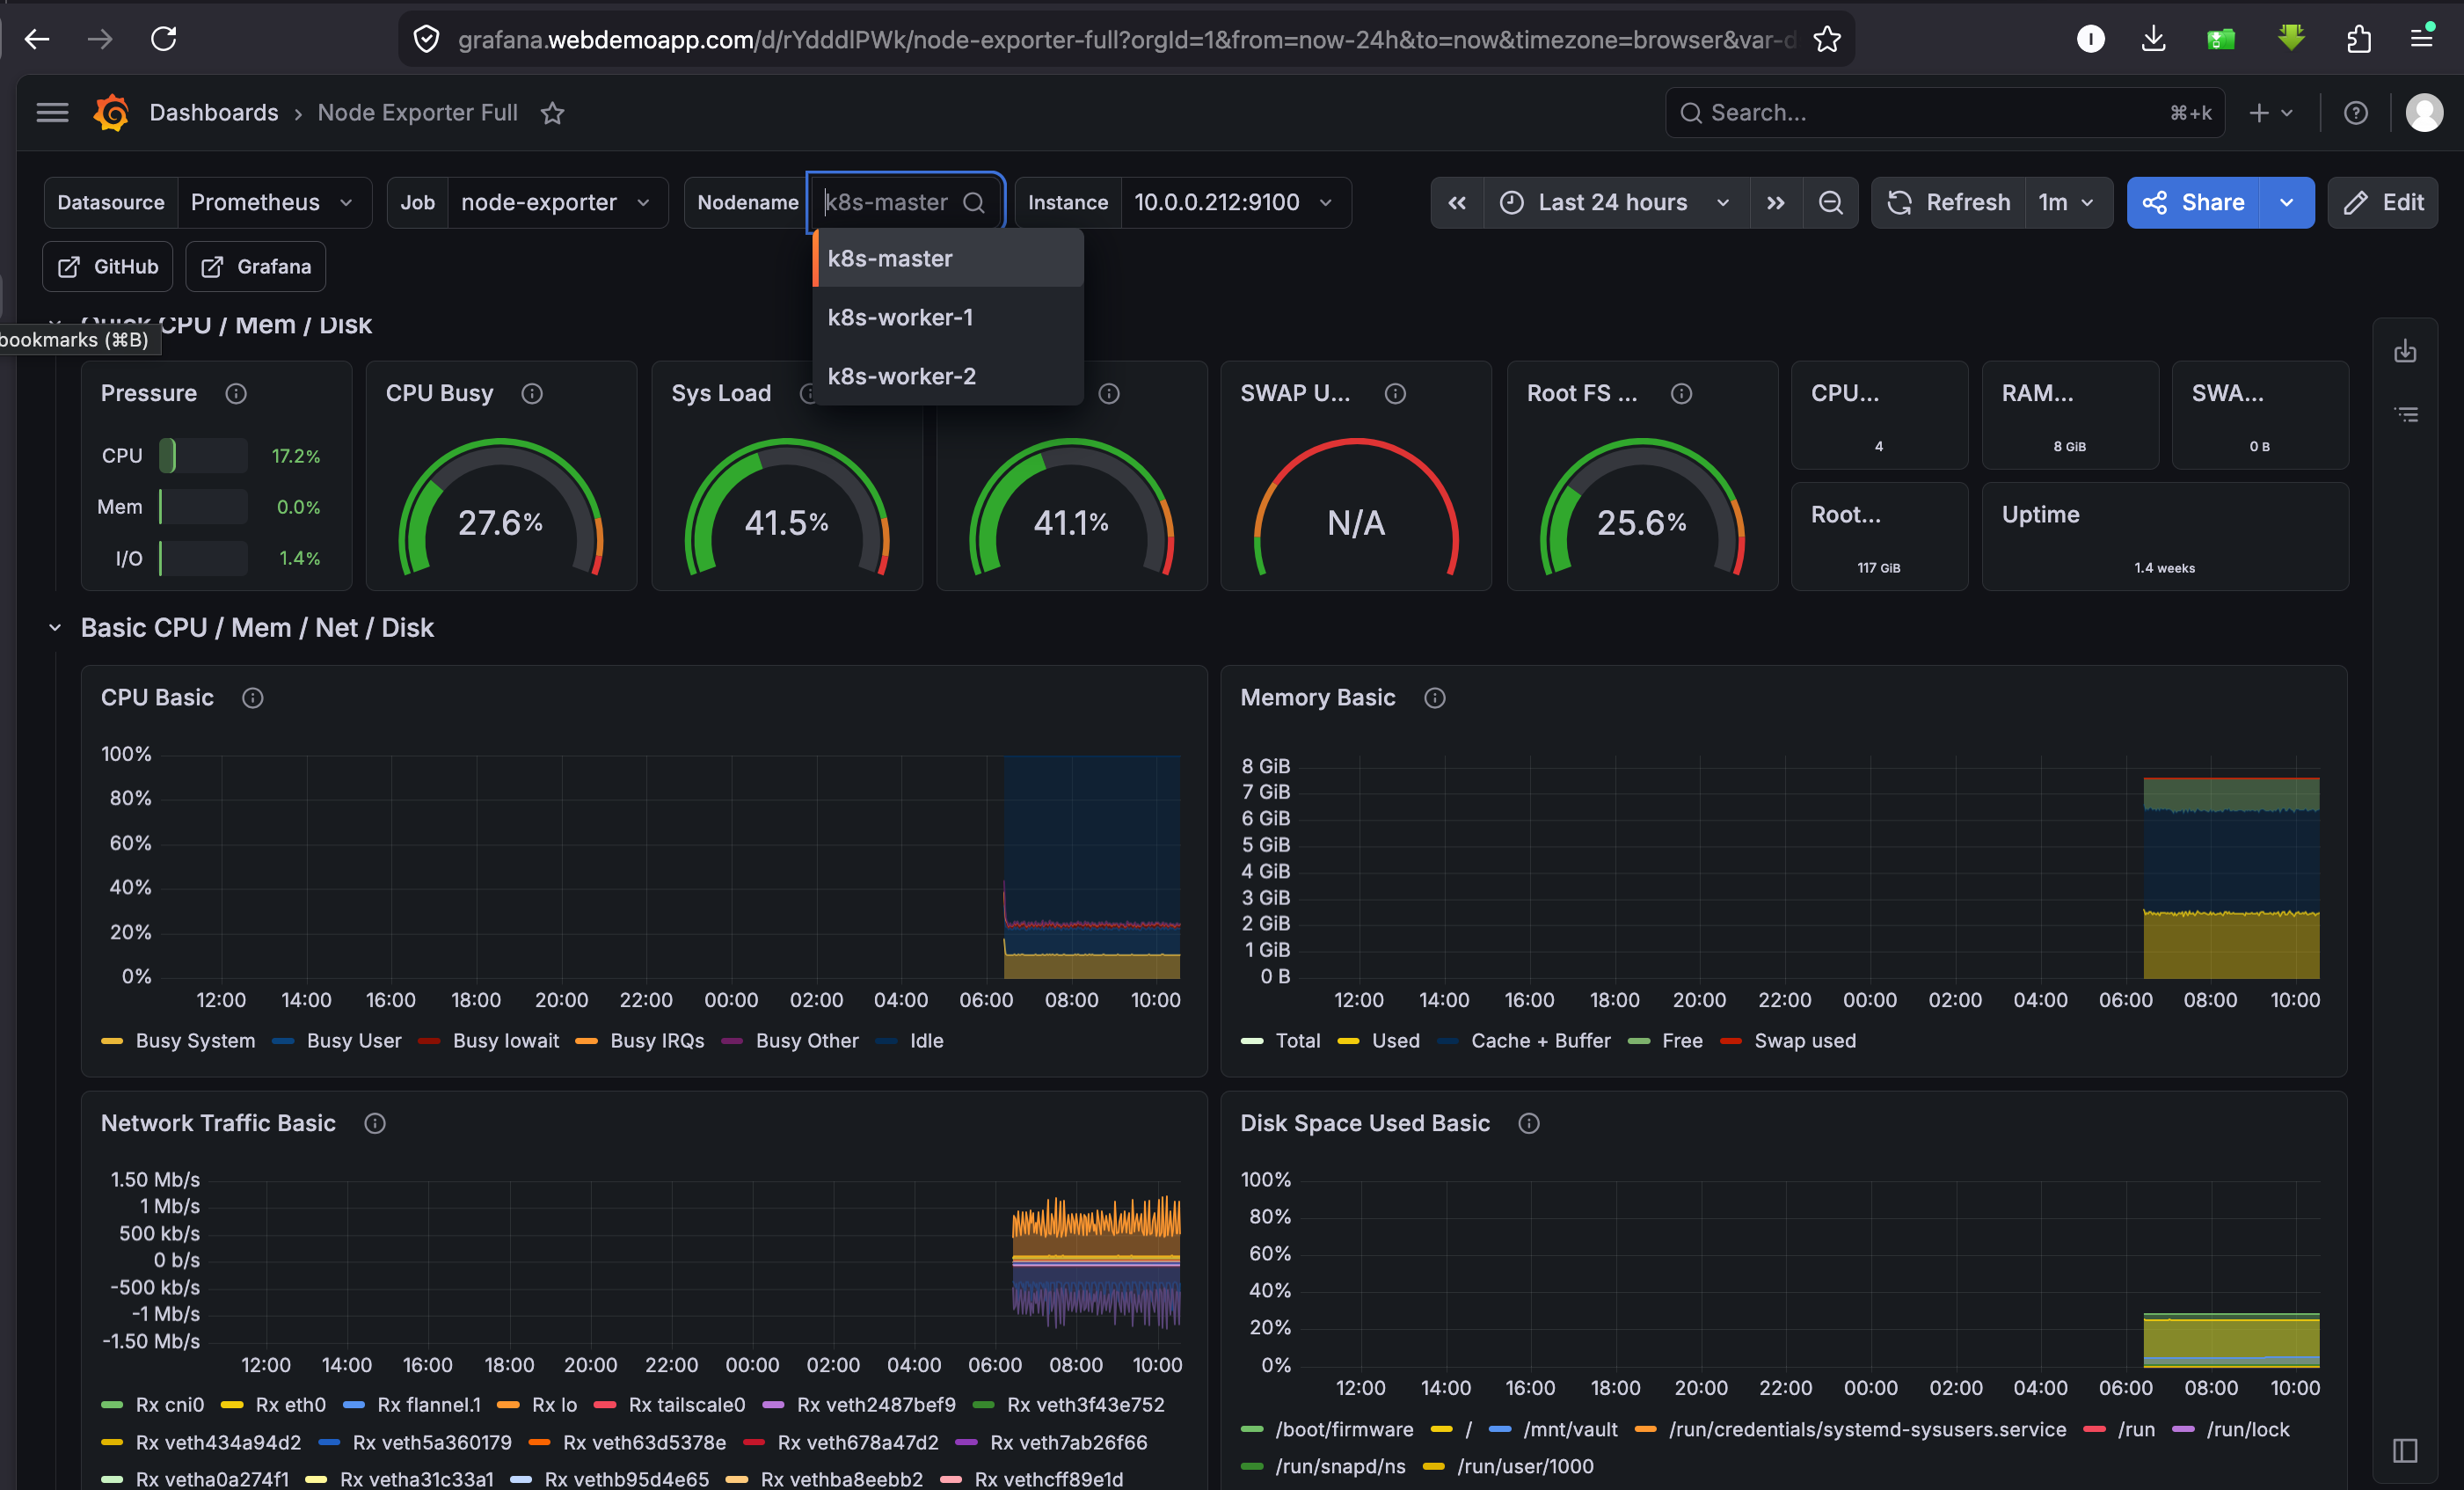
Dashboard 315 ("Kubernetes cluster monitoring via Prometheus") was less straightforward; everything showed N/A. That dashboard uses deprecated metric names that don't match those exported by the current kube-prometheus-stack. Dashboard 15661 is the replacement. It populated immediately: 3 nodes, 56 pods, 38 workloads, with a namespace breakdown showing monitoring, kube-system, argocd, and the rest.
About five hours after deployment, Grafana went down. The browser showed "upstream request timeout" — Envoy could reach the pod, but Grafana wasn't responding. The cause: exit code 137, which is OOMKilled. My initial memory limit of 256Mi was too tight. Grafana plus its two sidecar containers (dashboard discovery and datasource discovery) slowly consumed memory until the kernel killed the process.
The fix was simple: bump the limit to 512Mi. After a helm upgrade, Grafana restarted and has been stable since.
Prometheus targets: what's scraping what
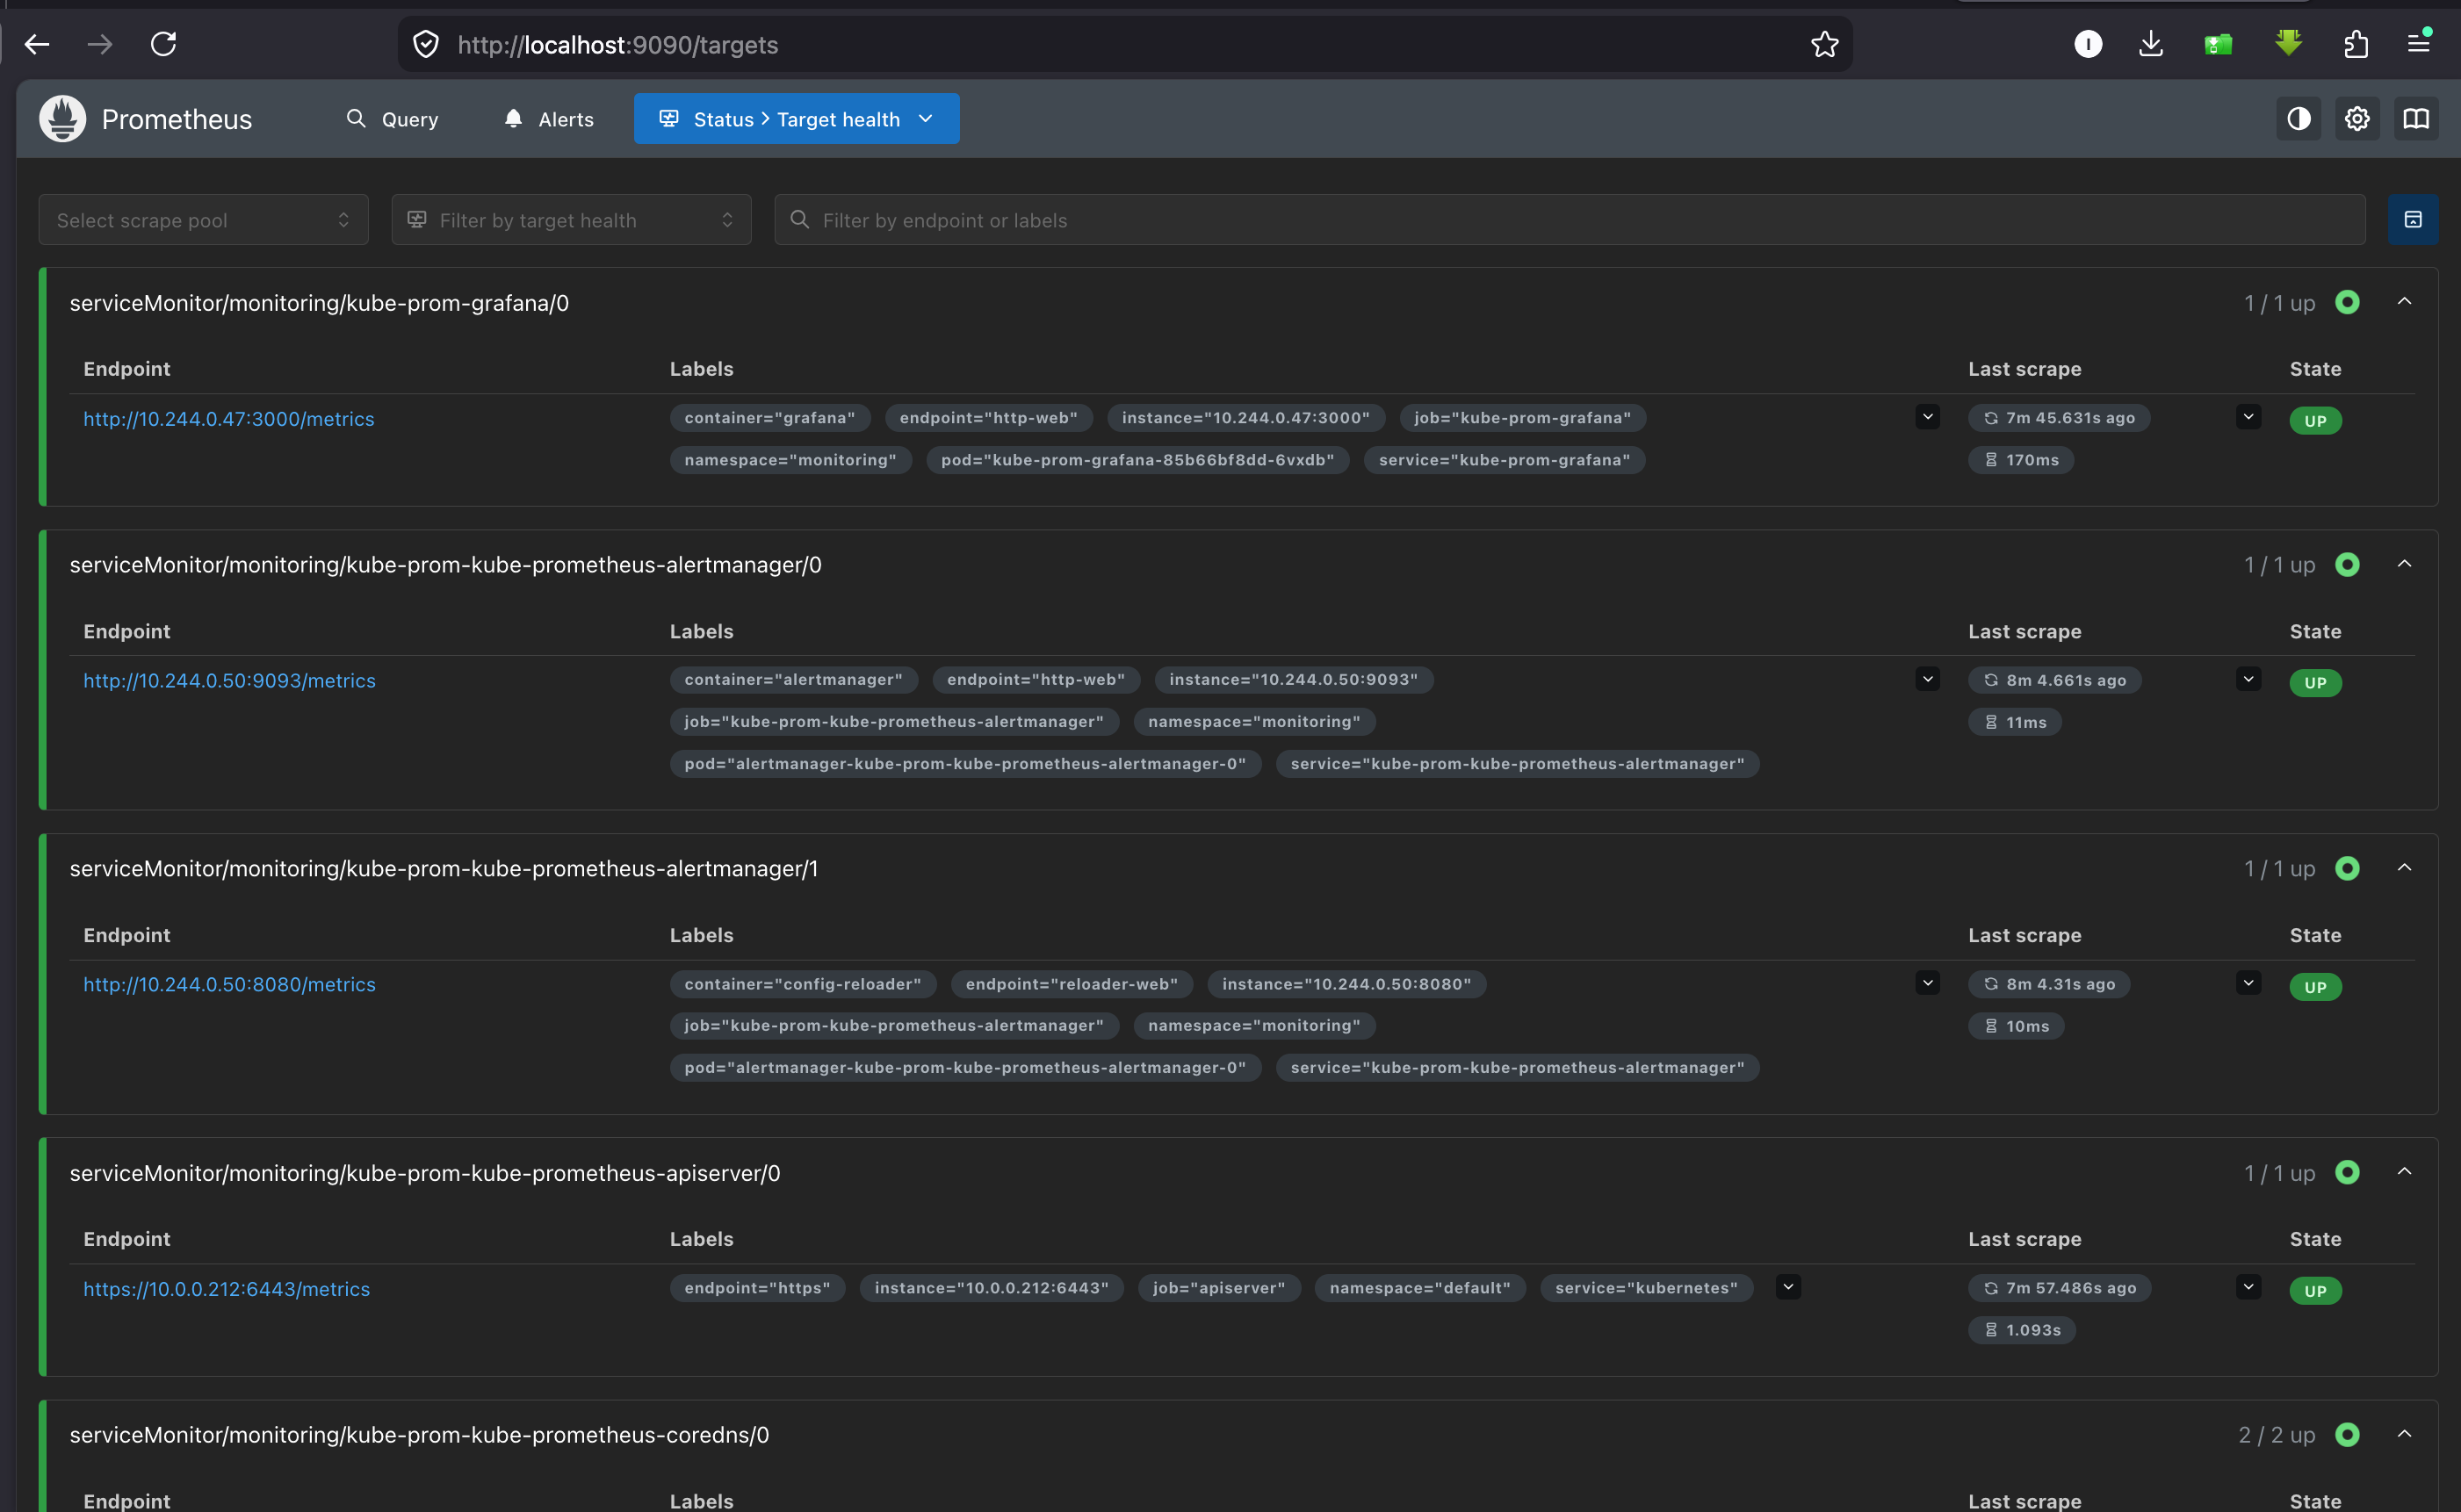
Opening localhost:9090/targets (via port-forward) shows every scrape target Prometheus is collecting from. All the built-in targets came up green: Grafana, Alertmanager, the API server, CoreDNS (2/2), node-exporter (3/3 across all nodes), kube-state-metrics, kubelet, and Prometheus itself.
Adding Podinfo as a custom scrape target
The built-in targets cover infrastructure. To monitor my own application, I needed a ServiceMonitor — a custom resource that tells the Prometheus Operator to generate a scrape config for a specific Service.
Podinfo exposes metrics on port 9898 at /metrics. The ServiceMonitor is simple: match the podinfo Service by label, scrape the http port every 15 seconds.
The first attempt didn't work. I created the ServiceMonitor in the podinfo namespace (next to the application), and Prometheus completely ignored it. No target appeared, no error in the logs. The Prometheus Operator's serviceMonitorNamespaceSelector was set to {} (all namespaces), so it should have picked it up.
It turns out the Operator only discovers ServiceMonitors in namespaces where it has RBAC access. The selector settings control which ServiceMonitors match and which namespaces to scrape targets from, but discovery itself requires the Operator's ServiceAccount to be able to list resources in that namespace. Moving the ServiceMonitor to the monitoring namespace — where the Operator definitely has access — fixed it immediately. All four endpoints appeared: two from the podinfo Service and two from podinfo-canary, all UP.
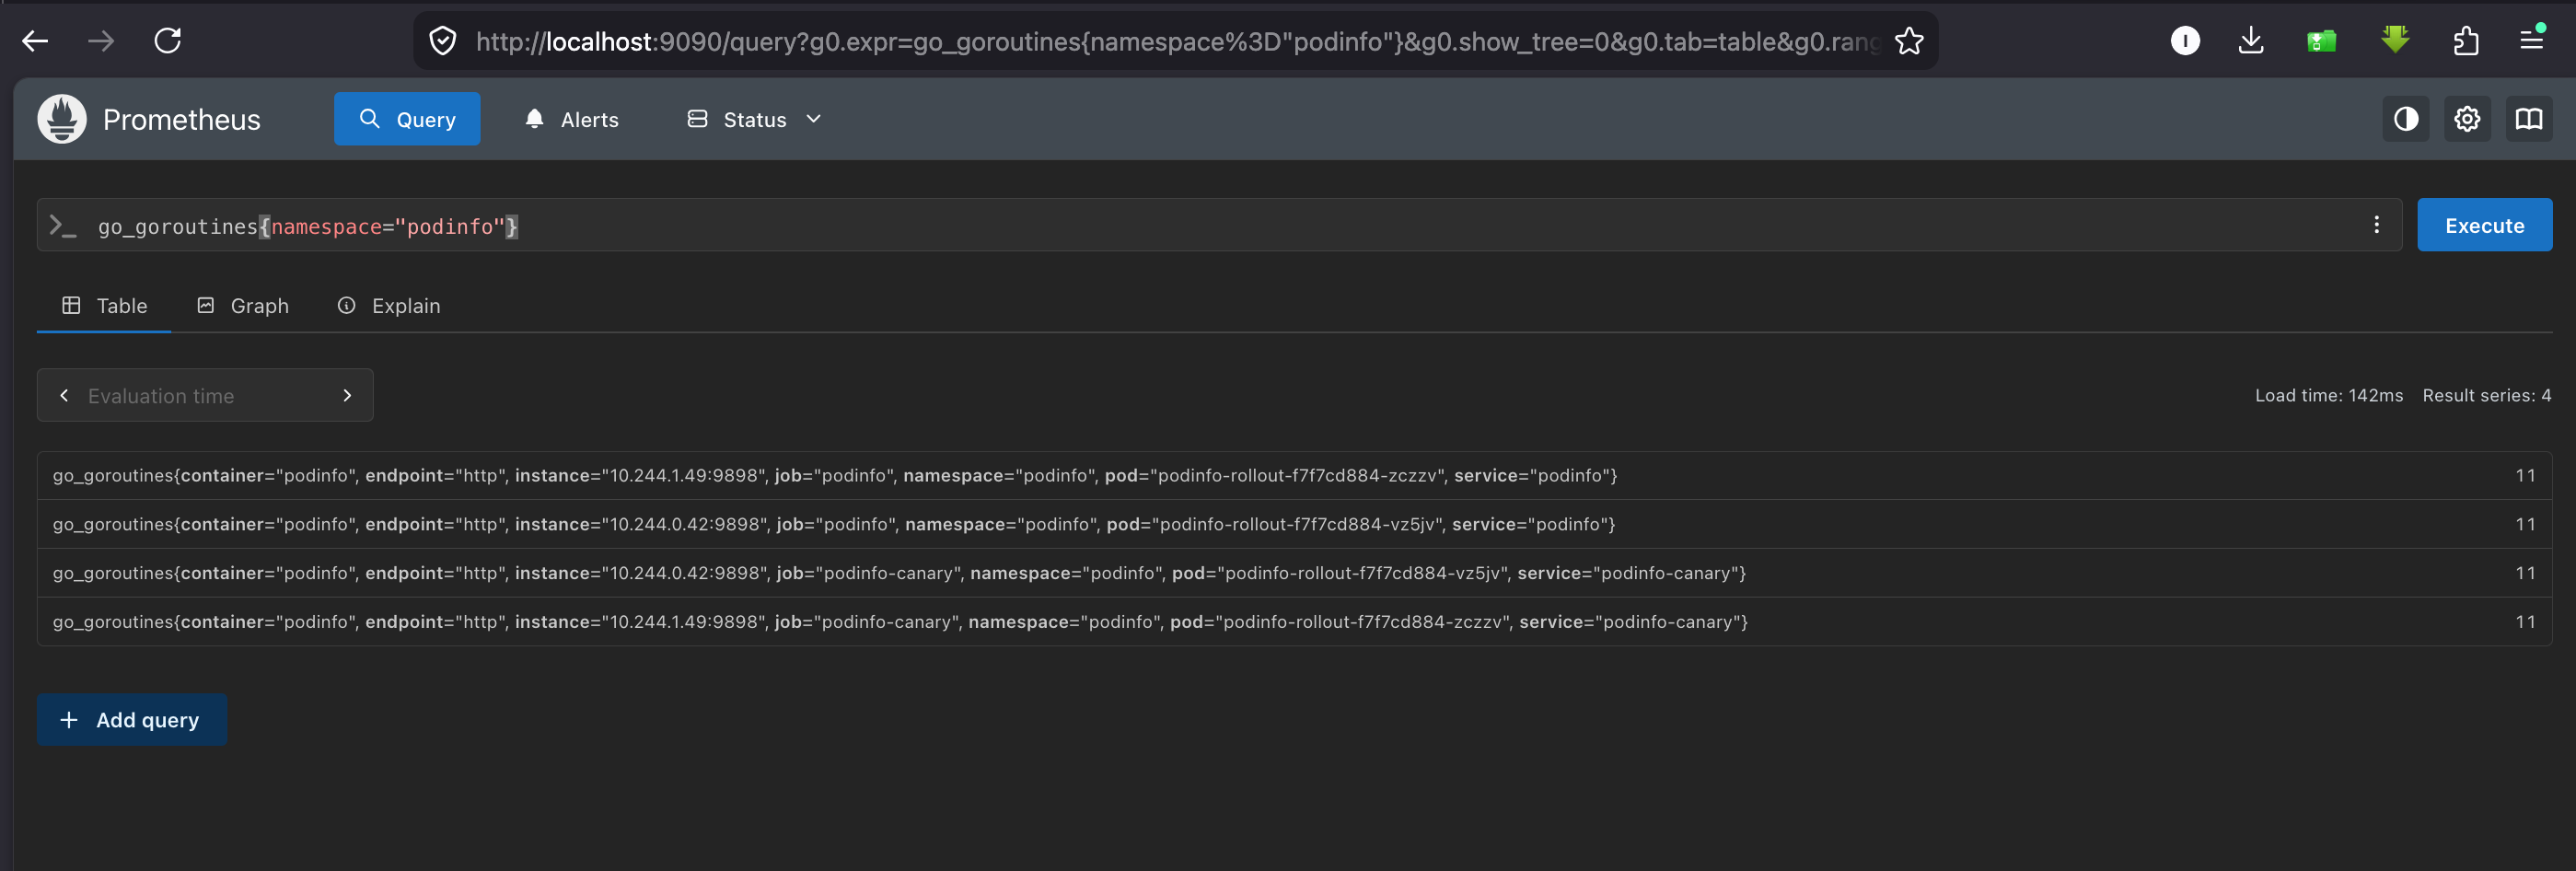
This is a common pattern: centralise all ServiceMonitors in the monitoring namespace and use namespaceSelector.matchNames to tell each one where to find the actual Service. It avoids the RBAC discovery issue entirely.
What I actually learned
Storage needs two guarantees, not one. WaitForFirstConsumer delays volume binding, but it doesn't control which node the pod schedules on. You need the nodeSelector too. Miss it and the PV might land on a different node's SD card instead of the SSD.
Default resource limits will OOMKill on Pi. Every component in kube-prometheus-stack needs explicit limits tuned for ARM64. Grafana's sidecars are the sneaky ones — they add memory overhead that isn't obvious from the main container's usage.
Dashboard 315 is deprecated. Use 15661 instead. Same concept, compatible with current metric names.
ServiceMonitor namespace matters for discovery. Even with serviceMonitorNamespaceSelector: {}, the Operator can only discover ServiceMonitors in namespaces it has RBAC for. Centralising them in the monitoring namespace is the safest pattern.
Grafana OOMKill is a slow burn. It won't crash immediately. It'll run fine for hours, slowly accumulating memory from sidecar activity and dashboard caching, then get killed by the kernel at the worst possible time. Set limits with headroom from the start.
What's next
Loki and Promtail for log aggregation, OpenTelemetry Collector and Tempo for distributed tracing. That completes the three pillars — metrics, logs, traces. Then Kyverno for policy enforcement and Falco for runtime threat detection.
Repo: github.com/charliepoker/homelab-k8s-gitops
Thank You!
About the author
DevOps Engineer with a proven track record of streamlining software development and delivery processes. Skilled in automation, configuration management, and continuous integration and delivery (CI/CD), with expertise in cloud infrastructure and containerization technologies. Possess strong communication and collaboration skills, able to work effectively across development, operations, and business teams to achieve common goals. Dedicated to staying current with the latest technologies and tools in the DevOps field to drive continuous improvement and innovation.
Comments
Join the discussionNo comments yet. Be the first to comment.